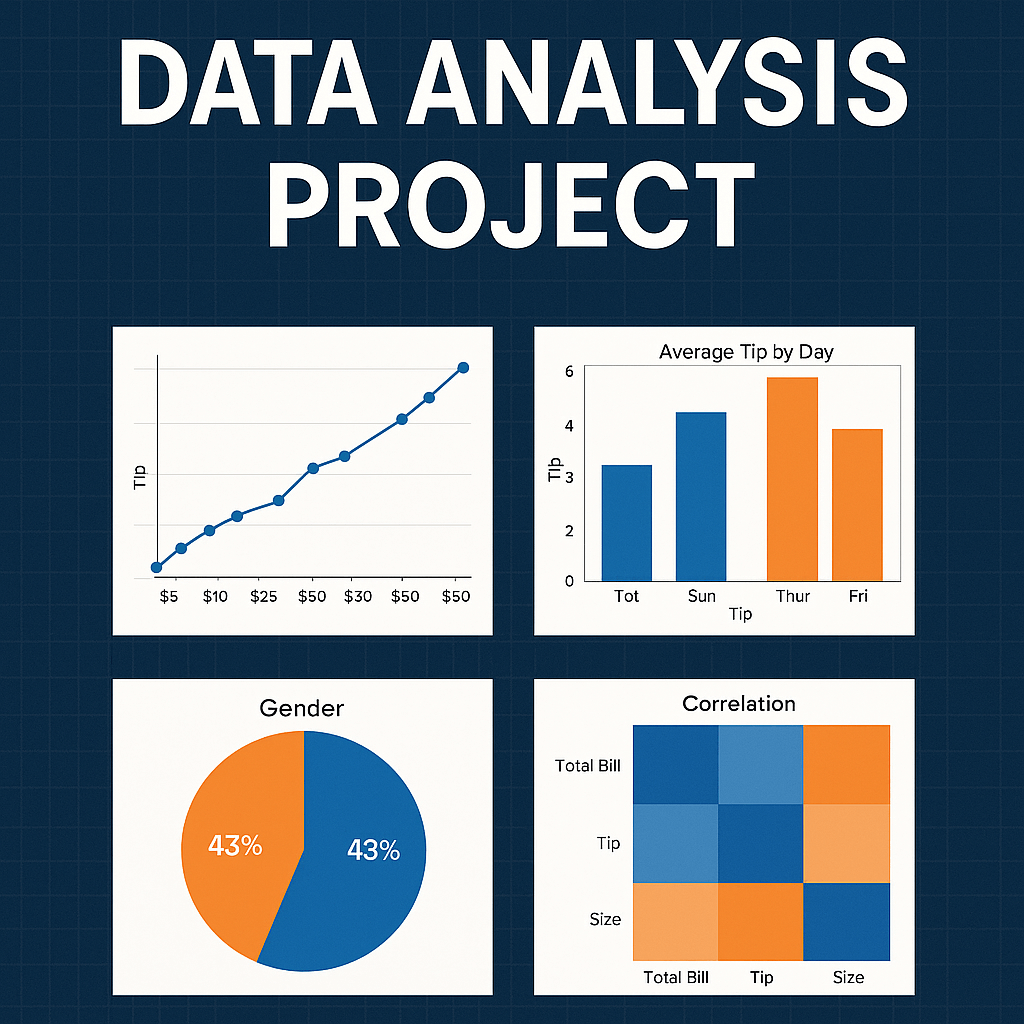
Restaurant Data Analysis Project
This sample project demonstrates a full data-cleaning and analysis workflow for a restaurant tipping dataset. The goal was to transform a raw CSV file into a structured, validated, and fully analyzed dataset using Python.
The client needed clear insights into customer behavior, including patterns based on meal time (Lunch vs Dinner), gender distribution, daily trends, smoking habits, and overall tipping performance. The raw file contained inconsistencies, missing values, formatting issues, and fields that required validation.
To address these challenges, I built a clean and organized Python script that loads the dataset, performs grouped analysis, summarizes gender counts by meal time and by day, identifies smoker patterns, and calculates total tip amounts for both male and female customers. I also structured the script with professional headings, making the output easy to read and client-friendly.
This project highlights my ability to read, clean, process, and analyze real-world datasets while delivering clear statistical insights. The process is repeatable, scalable, and can be customized for any dataset a client provides.
If you’re interested in exploring a full restaurant data analysis project, including the Python scripts, visualizations, dataset, and automatically generated PDF reports, you can view the complete project on GitHub. Everything is organised into clear folders, and you can see exactly how the analysis was built step-by-step.
👉 View the full project here: https://github.com/ameafshar/Restaurant-Data-Analysis-Project

